

What if your social feed is masking whether your membership is profitable?
Social platforms don’t work in straight lines: people see reels, shorts, comments, then sign up weeks later.
That mess breaks simple LTV (lifetime value) and CAC (customer acquisition cost) math unless you trace the first touch, the paid touch, and the subscription through one window.
This post shows a tight, practical framework to tag links, align monthly windows, and assign net ARPU and acquisition spend to social cohorts so you can tell which posts actually pay back, and which are losing you money.
Core Framework for Accurately Measuring LTV and CAC from Social-Driven Membership Acquisition

Measuring LTV and CAC from social content is different because social platforms don’t work in straight lines. A single member might see six Instagram Reels, one YouTube Short, and a friend’s recommendation before signing up. Revenue doesn’t tell you which channel or piece of content deserves credit, and most membership platforms can’t natively link subscriber dollars to the TikTok video that started everything. You need a framework that ties social content to paying customers and tracks them through the entire lifecycle.
The formulas are simple. For subscription LTV, use LTV = ARPU × gross margin ÷ monthly churn. For CAC, use Total acquisition spend ÷ new paying customers in the same period. A healthy benchmark is an LTV/CAC ratio around 3:1, with payback under 12 months. But here’s where most people mess up: if you measure ARPU monthly but calculate CAC quarterly, you’re comparing mismatched windows and the ratio falls apart. Pick monthly as your baseline, measure everything in the same 30-day window, and track every cohort from the first social touchpoint to subscription renewal.
To combine revenue data with social acquisition tracking, your membership platform needs to send order IDs, signup timestamps, and monthly churn data into your analytics system, where UTMs and pixel events have already captured the social source. That integration lets you calculate net ARPU by channel after platform fees (web checkout at 3.9% and in-app at 15–30%) and assign LTV and CAC to the cohort that came from each piece of content.
Five essential steps for direct calculation:
- Tag every social link with UTM parameters (source, medium, campaign, content) so you know which post or ad drove the click.
- Measure all paid and organic social acquisition costs over the same monthly period. Ad spend, creative production, influencer fees, social management software.
- Pull channel-specific ARPU net of platform fees. If 60% sign up via web at $27.87 ARPU and 40% via in-app at $24.65, your blended ARPU is $26.78.
- Measure monthly churn and calculate LTV using the subscription formula. With $26.78 ARPU, 92% margin, and 4% monthly churn, LTV = $26.78 × 0.92 ÷ 0.04 = $615.
- Compute CAC by dividing total acquisition spend by new paying customers that month, then calculate LTV/CAC for each social cohort to spot which channels pay back fastest.
Tracking Membership-Site LTV from Social Content Performance

ARPU and churn differ across social cohorts because audience intent and engagement depth vary by platform. A TikTok cohort might arrive with high energy but shallow commitment, leading to 6% monthly churn. An Instagram cohort that engaged with three story sequences before signing up might show 3% churn and higher annual plan take-up, lifting ARPU by 15%.
To derive margin-adjusted ARPU, start with the monthly subscription price, subtract platform fees and payment processing costs, then subtract direct delivery costs like video hosting and support time. If your $29 plan incurs 3.9% web fees and 8% delivery costs, your net margin is about 88%, and net ARPU is $29 × 0.88 = $25.52.
Cohort retention curves reveal LTV lift over time. A member who completes onboarding in the first seven days and engages with the community in the first 30 days has a 40% higher chance of staying past 90 days. Measuring LTV at 30, 90, and 365 days for each social source shows which content builds durable relationships, not just quick signups.
| Cohort Source | ARPU | Monthly Churn | LTV |
|---|---|---|---|
| Instagram Reels | $26.50 | 4.5% | $543 |
| TikTok Videos | $24.80 | 6.0% | $381 |
| YouTube Shorts | $27.10 | 3.8% | $657 |
| Organic Social Posts | $28.00 | 3.2% | $806 |
Calculating Social CAC with Precision Across Paid, Organic, and Influencer Channels
Organic content CAC looks like zero until you account for the hours spent scripting, filming, editing, and responding to comments. If you’re paying a content manager $4,000 a month and they produce 20 pieces that drive 80 signups, your organic CAC is roughly $50 per customer. Paid media CAC is cleaner because you have a direct ad spend number, but you still need to add creative production and platform management software. Influencer campaigns require tracking both the flat fee and any revenue-share arrangement, divided by the number of paying customers attributed to that partnership within your chosen window.
Spend must always align with paying customer counts, not leads or email signups. If you spent $10,000 on TikTok ads in March and acquired 150 email leads but only 90 became paying members, your CAC is $10,000 ÷ 90 = $111, not $67. The denominator is always new paying customers, and the numerator is every dollar that went into acquiring them during that same period.
Payback matters because it tells you how fast you recover CAC to reinvest. If your CAC is $120, monthly ARPU is $25, and gross margin is 70%, payback = $120 ÷ ($25 × 0.70) = 6.86 months. Target payback under 12 months. Five to seven months is strong and lets you scale without running out of cash.
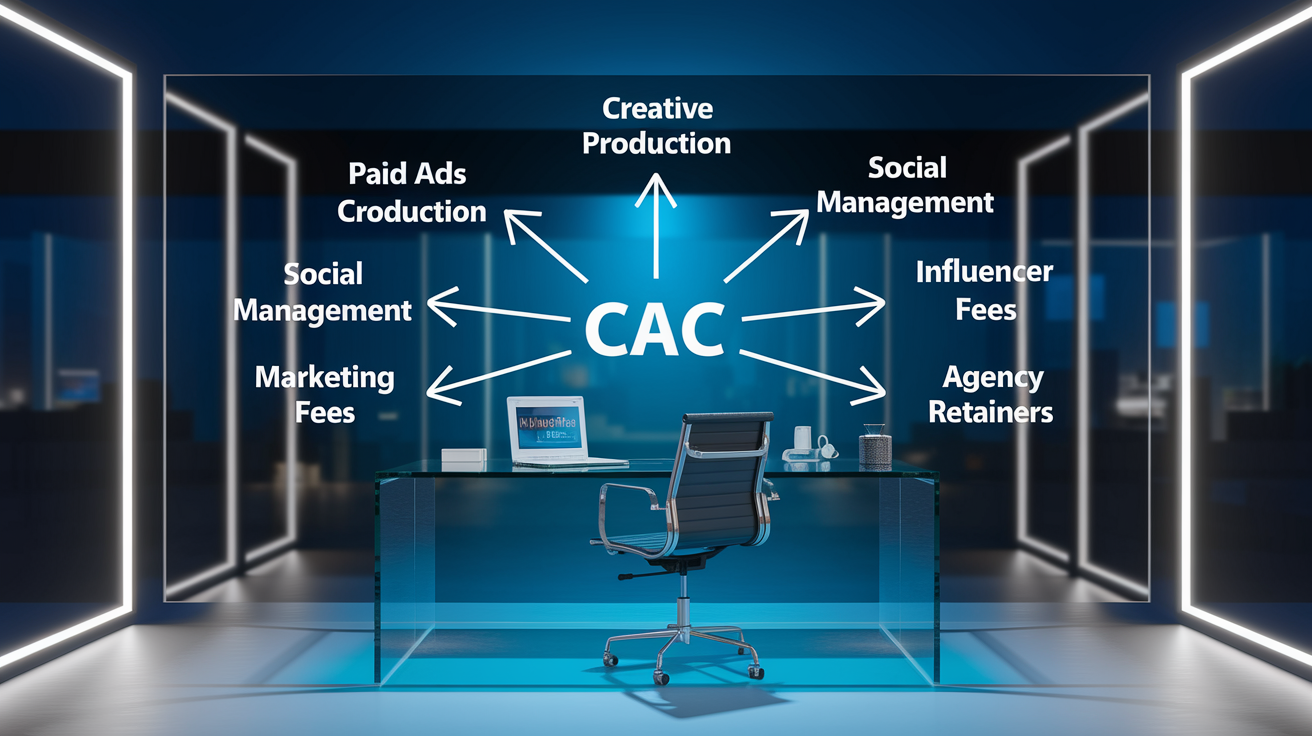
Six cost components that must be included:
- Paid ads spend across all social platforms
- Creative production (video editing, graphic design, copywriting)
- Social management tools (scheduling, analytics, engagement software)
- Influencer fees (flat payments, commissions, gifted memberships)
- Marketing salaries tied to acquisition (prorated if they also handle retention)
- Agency retainers for campaign strategy and execution
Attribution Models for Mapping Social Content to Membership Conversions
First-Touch, Last-Touch, and When They Fail
First-touch attribution gives all credit to the earliest known interaction, the Instagram Reel a user saw three weeks before signing up. Last-touch gives all credit to the final click, often a Google search for your brand name after they’d already been warmed by social. Both models fail in membership funnels because social content rarely converts on first exposure. A member might watch a TikTok, ignore it, see two more Instagram posts, click a retargeting ad, land on your page, leave, get an email, then finally subscribe. Giving 100% credit to any single touchpoint hides the role of the others.
Multi-Touch and Time-Decay Models
Multi-touch attribution distributes credit across every interaction in the buyer’s journey. Position-based models give 40% to the first touch, 40% to the last, and split the remaining 20% among middle touches. Time-decay models give more weight to recent interactions. For social-driven memberships, time-decay or position-based models better capture the nurturing role of content. You see which pieces start the conversation and which close it.
Attribution Windows for Social Funnels
Attribution windows define how long after seeing content a signup can be credited to that source. Meta and TikTok default to 7-day click and 1-day view windows, but membership purchase cycles often run 14–28 days. Set a 28-day click window and 7-day view window, then measure which social content appears in winning paths. Standardize windows across platforms so you’re comparing like-to-like. Mixing a 7-day window on Instagram with a 28-day window on YouTube will inflate YouTube’s share.
Five places where attribution breaks without proper setup:
- Missing UTM tags on organic social links
- Duplicate pixels firing on the same page
- No server-side conversion tracking when cookies fail
- Attribution windows shorter than your actual funnel duration
- Membership platform not passing order IDs back to analytics
GA4, Pixels, and Event Tracking Architecture for Accurate Social-to-Membership Measurement

Set up event tracking so every social touchpoint, signup, and subscription payment flows into one system where you can calculate CAC and LTV by cohort. You need three event categories: acquisition events (ad impression, link click, landing page view), conversion events (account creation, trial start, first payment), and retention events (lesson completion, community post, renewal). Each event should carry UTM parameters and a unique user ID so you can trace the path from social content to revenue.
Required Core Events (Signup, Subscription, Cancellation)
Your membership platform must fire a “signup” event with timestamp and source when a user creates an account, a “subscription_start” event when they pay, and a “cancellation” event when they churn. Pass the order ID and subscription tier into GA4 as event parameters so you can tie revenue to the cohort. Model platform fees as a margin reduction, not CAC. Apple’s 15–30% cut lowers your net ARPU, but it’s not an acquisition cost.
Using Server-Side Tracking for Reliability
Browser-based pixels fail when users block cookies or use privacy-focused browsers. Server-side tracking sends conversion data directly from your membership platform to Meta’s Conversion API or Google’s Measurement Protocol, bypassing the browser. Set up both pixel and server-side tracking. The combination improves match rates and attribution accuracy by 20–30%.
Event Naming and Taxonomy Standards
Use a consistent naming convention across all platforms: “socialclick,” “landingview,” “trialstart,” “subscriptionpaid,” “memberchurned.” Measure every event in the same monthly window so ARPU, churn, and CAC align. Inconsistent taxonomy (calling one event “signup” on Meta and “accountcreated” in GA4) breaks reporting and inflates troubleshooting time.
Five steps for wiring GA4, pixels, and conversions:
- Deploy Meta Pixel, TikTok Pixel, and GA4 tags on your landing and checkout pages using a tag manager.
- Configure GA4 custom events for signup, subscription start, and cancellation, passing UTM parameters and order IDs as event parameters.
- Set up server-side conversion tracking using your membership platform’s webhook to send subscription events to Meta CAPI and Google Measurement Protocol.
- Add UTM parameters to every social link and ensure your landing page script reads and stores them in a session cookie.
- Build a GA4 Exploration report grouping conversions by utmsource, utmmedium, and utm_campaign to calculate cohort LTV and CAC.
Mapping Social Content to Full-Funnel Membership Metrics
Social content operates at every funnel stage. Short-form videos (Reels, TikTok, Shorts) drive awareness and early interest. Live streams and Q&A content build trust in the consideration phase. Testimonials and case studies close in the decision phase. You need to tag each content type so you can see which formats contribute to conversion and which exist only to entertain. Awareness content might show low direct conversion but high assist rates. Users who watch a Reel don’t subscribe immediately but return two weeks later after seeing three more pieces.
Engagement levels correlate with conversion probability. A user who watches 90% of a YouTube Short and leaves a comment has a 4× higher signup rate than someone who scrolls past after three seconds. Track engagement depth by content piece (completion rate, comment rate, share rate) and measure how those cohorts convert. Higher engagement cohorts also show better retention because they arrived with clearer intent and stronger connection to your message.
Long-term retention gets shaped by the content that brought a member in. If someone subscribed after watching a detailed tutorial, they expect structured lessons and support. If they joined after a motivational Reel, they expect energy and community. Match your onboarding flow to the content promise, and you’ll see lower early churn. Track 30-day active rates and 90-day retention by the social content type that drove signup. The patterns reveal which content builds durable membership relationships, not just fleeting curiosity.
Optimizing LTV and CAC from Social Content Through Retention, ARPU, and Acquisition Efficiency
Improving LTV and reducing CAC are the two levers that expand profitability. You can’t control platform fees or payment processing, but you can control how long members stay, how much they spend, and how efficiently you acquire them. Small retention improvements compound because every extra month adds margin-adjusted ARPU to LTV. Raising retention from 18 months to 20 months lifts a $25 ARPU member from $450 LTV to $500 LTV, an 11% gain for the same acquisition cost.
Social signals tell you which tactics will work. If Instagram story engagement predicts higher annual plan take-up, send Instagram cohorts an upgrade offer on day 15 with a short video testimonial. If TikTok cohorts engage more with in-app challenges, launch a 30-day challenge starting on day three and reward completion with a badge and community shout-out. Match retention and upsell tactics to the behavior patterns that drove the signup.
Improving ARPU and Retention to Lift LTV
Retention tactics work best when they deliver quick wins in the first seven days. Send a welcome email on day one with a single high-value lesson, a push notification on day three celebrating their first completion, and a community invite on day seven. Weekly nudges after that (new content alerts, engagement streaks, peer progress comparisons) keep members active. ARPU lifts come from annual plans (offer a two-month discount), bundles that add office hours or one-on-one support, and upsells triggered after milestone completions. Route high-ticket sales to web checkout instead of in-app to avoid the 15–30% Apple/Google cut.
Six optimization levers shaped by social behavior signals:
- Run 7-day onboarding flows personalized to the social content that drove signup
- Offer annual plan upgrades with video testimonials from the cohort’s original social platform
- Launch in-app challenges and gamification for cohorts that engage with short-form content
- Use referral boosts after lesson completion, tracked back to the referring member’s social source
- Iterate creative weekly on the top three audiences, measuring CAC and payback by ad set
- Track CAC by channel and cohort to spot early churn risk and pause underperforming sources
Dashboards and Reporting Cadence for LTV and CAC Visibility

Monthly recalculation of CAC and quarterly LTV reviews keep your metrics accurate as product mix, pricing, and channel performance shift. Calculate CAC every month during active campaigns. If you’re running paid social ads, measure spend and new customers at month-end and update your dashboard. Recalculate cohort LTV every 90 days because retention curves stabilize after the first three months. Earlier than that, you’re extrapolating from incomplete data.
Track four core KPIs in a single dashboard: ARPU (monthly average per paying customer), CAC (total acquisition spend divided by new customers that month), monthly churn (customers lost ÷ customers at start of month), and LTV/CAC ratio. Update ARPU and churn monthly, CAC after every campaign or monthly if campaigns are continuous, and the ratio whenever the inputs change. Avoid double counting by ensuring each customer appears in only one acquisition cohort and each dollar of spend gets attributed to one period.
| KPI | Purpose | Cadence | Data Source |
|---|---|---|---|
| ARPU | Average monthly revenue per paying member | Monthly | Membership platform revenue ÷ active subscribers |
| CAC | Cost to acquire one new paying customer | Monthly (during campaigns) | Ad platform spend + production + salaries ÷ new customers |
| Churn | Percent of members who cancel each month | Monthly | Membership platform cancellations ÷ start-of-month count |
| LTV/CAC Ratio | Profitability and scale potential of acquisition | Quarterly or when inputs change | LTV ÷ CAC by cohort |
Numeric Case Study: Social Spend, Member Cohorts, and Resulting LTV/CAC

In March 2025, a fitness membership site spent $22,000 across four social channels and acquired 220 new paying members. ARPU was $27, blended across web and in-app signups, with an 88% gross margin after platform fees and delivery costs. Monthly churn ran 4.2%. LTV = $27 × 0.88 ÷ 0.042 = $566. Total CAC = $22,000 ÷ 220 = $100. LTV/CAC ratio = $566 ÷ $100 = 5.66:1, well above the 3:1 target and indicating room to scale spend.
Breaking down by channel revealed which social platforms delivered the best unit economics. Instagram Ads ran $8,000 and brought 95 members at $84 CAC, with slightly higher ARPU ($28) and lower churn (3.9%), yielding LTV $634 and a ratio of 7.5:1. TikTok Ads cost $7,500 for 70 members ($107 CAC), but churn hit 5.1%, dropping LTV to $466 and the ratio to 4.4:1. YouTube Organic required $3,000 in production time and drove 35 signups ($86 CAC), with the lowest churn at 3.5%, LTV $679, and ratio 7.9:1. Influencer Referral ran $3,500 for 20 members ($175 CAC), but those members took annual plans at higher rates, lifting ARPU to $31 and LTV to $707, yielding a 4.0:1 ratio despite high upfront cost.
| Channel | CAC | LTV | LTV/CAC |
|---|---|---|---|
| Instagram Ads | $84 | $634 | 7.5:1 |
| TikTok Ads | $107 | $466 | 4.4:1 |
| YouTube Organic | $86 | $679 | 7.9:1 |
| Influencer Referral | $175 | $707 | 4.0:1 |
The analysis showed Instagram and YouTube Organic delivered the fastest payback (under 5 months) and highest ratios, so April budget shifted 60% to those channels. TikTok remained in the mix for volume but with stricter creative testing to reduce churn. Influencer partnerships moved to annual-plan-only promotions to justify the higher CAC.
Tooling Ecosystem for Measuring Social-Driven LTV and CAC in Membership Models

You need four categories of tools: analytics platforms to measure events and calculate metrics, CRM systems to store customer lifecycle data, attribution tools to connect social touchpoints to conversions, and feedback tools to understand why members stay or leave. Start with GA4 or Mixpanel for event tracking and funnel analysis. Add a CRM like HubSpot or Salesforce to centralize customer records, subscription status, and LTV over time. Use server-side tracking integrations (Meta CAPI, Google Measurement Protocol) to improve match rates when cookies fail.
Attribution gets easier when your analytics platform can import ad spend and map it to conversions by UTM and cohort. Most membership platforms offer native integrations with Meta, Google, and TikTok that sync conversion events automatically. If yours doesn’t, use Zapier or custom webhooks to push subscription events from your platform into your CRM and analytics tools. Track feedback with quick in-app surveys (Zigpoll, Typeform) after key milestones (first lesson completion, 30-day mark, cancellation) to understand what drives retention and where members drop off.
For fast setup, use free LTV/CAC templates in Excel or Google Sheets that let you plug in ARPU, churn, and CAC to get instant ratio and payback calculations. Pair that with your membership platform’s built-in analytics dashboard to pull monthly revenue, subscriber counts, and churn. Most creators can build a working LTV/CAC model in under an hour using platform data and a simple spreadsheet, then graduate to full analytics stacks as volume grows.
Recommended tool categories:
- Analytics: Google Analytics 4, Mixpanel, Amplitude for event tracking and cohort analysis
- CRM: HubSpot, Salesforce to centralize customer data and automate lifecycle tracking
- Attribution: Server-side conversion APIs (Meta CAPI, Google Measurement Protocol) for reliable tracking
- Feedback: Zigpoll, Typeform, SurveyMonkey for post-signup and exit surveys
- Templates: Free LTV/CAC Excel calculators and membership platform analytics for rapid modeling
Final Words
Start measuring now: this post gave a step-by-step blueprint — tag social links, align spend to cohorts, use LTV = ARPU × gross margin ÷ monthly churn, and CAC = total acquisition spend ÷ new paying customers.
We covered attribution models (multi-touch, time-decay), GA4 plus server-side tracking, cohort LTV tracking (30/90/365 days), and dashboards with monthly recalculations and payback targets.
Use the worksheets, aim for a 3:1 LTV/CAC benchmark and under-12-month payback, and keep testing. measuring LTV and CAC from social content for membership sites will uncover which channels truly pay off. You’ll get clearer signals and smarter spend.
FAQ
Q: How do I calculate lifetime value (LTV) for members acquired from social media?
A: Calculating LTV for members acquired from social media uses LTV = ARPU × gross margin ÷ monthly churn. Example: ARPU $26.78, margin 92%, churn 4% → LTV ≈ $615.
Q: How do I calculate customer acquisition cost (CAC) for social channels?
A: Calculating CAC for social channels divides total acquisition spend by new paying customers in the same period. Example: $10,000 spend ÷ 200 customers = $50 CAC.
Q: What LTV/CAC benchmark should membership sites target?
A: The LTV to CAC benchmark is about 3:1, with payback under 12 months. Strong programs aim for 5 to 7 months payback when possible.
Q: How should I attribute memberships to social posts across multi-touch journeys?
A: Attributing memberships across multi-touch journeys uses UTMs, cohort tracking, and a multi-touch or time decay model. Standardize attribution windows, often 7 to 28 days, for consistent results.
Q: What tracking setup do I need in GA4 and server-side to measure social-to-membership conversions?
A: Tracking for social-to-membership needs UTMs, GA4 events for signup, subscription and cancellation, passing order IDs, and server-side conversion API to reduce attribution loss and improve reliability.
Q: What costs should I include when calculating social CAC?
A: When calculating social CAC include paid ads, creative production, social tools, influencer fees, acquisition-related salaries, and agency retainers. Exclude product delivery or ongoing service costs.
Q: How do I use cohorts to improve LTV measurement for social-acquired members?
A: Using cohorts to measure LTV means tracking source-specific ARPU and monthly churn across 30, 90, and 365 day windows. Compare retention curves to see LTV lift after the first 30 to 90 days.
Q: How can I reduce CAC and increase LTV from social content?
A: Reducing CAC and raising LTV focuses on better onboarding (first 7 days), ARPU boosters like annual plans or bundles, creative testing to lift conversion, and referral or retention campaigns.
Q: What dashboard KPIs and reporting cadence should I use for LTV and CAC?
A: Your dashboard should recalc LTV and CAC monthly, review 30 and 90 day cohorts, and show ARPU, churn, payback months, and the LTV/CAC ratio to spot spikes or data issues.
Q: Which tools integrate best for measuring social-driven LTV and CAC?
A: Tools that work well include GA4 for web analytics, Mixpanel or Amplitude for product events, HubSpot or Salesforce for CRM, server-side tracking for accuracy, and feedback forms like Typeform.
Q: How do I compute CAC payback period for social acquisitions?
A: Computing CAC payback divides CAC by monthly net contribution: CAC ÷ (ARPU × gross margin). Example: $120 ÷ ($25 × 70%) ≈ 6.86 months to recover CAC.
Q: What common attribution problems break social-to-membership measurement?
A: Common attribution failures include missing UTMs, inconsistent attribution windows, cross-device gaps, server-side tracking not set up, and double counting across channels.