

Want investors to take you seriously?
Hit a 3:1 LTV to CAC ratio.
While many startups fall between 2:1 and 4:1, 3:1 is the practical sweet spot: it covers costs, funds growth, and shows unit economics that scale.
Below 1:1 you’re losing money; above 4:1 often means you’re underinvesting in growth.
This post gives clear benchmarks by stage and business model, shows how to calculate both numbers, and lists three immediate steps to move your ratio toward health.
Core Benchmarks for the LTV to CAC Ratio in Startups

Most startups need an LTV to CAC ratio somewhere between 2:1 and 4:1. The sweet spot? 3:1. That’s the number investors know by heart. It means every dollar you spend acquiring a customer comes back as three dollars in lifetime value. You’ve got room to cover your costs, fund growth, and actually turn a profit.
Below 1:1 is a death spiral. You’re spending more to get customers than they’ll ever give you back. Above 4:1 sounds impressive until you realize what it actually means: you’re sitting on great unit economics but you’re not pushing hard enough on growth. That extra margin should be going back into acquisition. If you’re generating four times return and not reinvesting, you’re basically handing market share to competitors who are.
Investors read this ratio differently depending on where you are. At seed stage, they get it. You’re still figuring out product-market fit, testing channels, learning what works. A 2:1 ratio is fine if you can show the trend line moving up and a realistic plan to hit 3:1 as you scale. By Series A and beyond, they want to see 3:1 consistently across cohorts, plus a payback period under twelve months. They’re looking for proof that your customer acquisition isn’t just working, it’s repeatable and capital efficient.
Here’s where the numbers land:
- Below 1:1: You’re losing money on every customer. Period.
- 1:1 to 2:1: Dangerous zone. You might justify it in the short term while funding early growth, but it can’t last.
- 3:1: The target. Sustainable, investor-friendly, leaves you room to operate.
- Above 4:1: Sounds great, probably means you’re too cautious with acquisition spend. Strong economics, but you’re likely underinvesting in growth.
When you walk into a funding meeting with a 3:1 ratio and clean cohort data, you’re speaking their language. The ratio becomes shorthand for whether your growth model can scale without burning cash faster than you can generate returns.
Calculating LTV and CAC for Accurate Ratio Benchmarking

Customer lifetime value starts with average revenue per account, adjusted for the margin you keep and how long customers stick around. Quick example: if your monthly subscription is a hundred dollars, your gross margin is eighty percent, and customers stay for twenty-four months on average, your LTV is a hundred times 0.8 times twenty-four. That’s $1,920. The margin adjustment matters because LTV should reflect what you actually keep after delivering the product, not just top-line revenue.
Customer acquisition cost includes everything you spend to bring in new customers during a set period. Ad spend across all channels. Sales and marketing salaries. Commissions. Agency fees if you’re outsourcing creative or media buying. Software subscriptions for analytics, CRM, email platforms. Any overhead directly tied to acquisition, like office space for the sales team or onboarding support. Divide that total by the number of new customers you acquired in the same window, and you’ve got your CAC. A lot of startups skip the overhead items and end up with a CAC number that looks better than it is. That works until you try to scale and the real cost shows up.
| Metric | Formula | Key Inputs |
|---|---|---|
| LTV (Customer Lifetime Value) | ARPA × Gross Margin % × Customer Lifetime | Average revenue per period, margin after variable costs, average retention length or inverse of churn rate |
| CAC (Customer Acquisition Cost) | Total Acquisition Spend ÷ New Customers Acquired | Ad spend, sales salaries, commissions, agency fees, software, analytics, acquisition-related overhead |
| LTV:CAC Ratio | LTV ÷ CAC | Fully loaded LTV and CAC from the same cohort and time period |
Industry Variations in LTV to CAC Ratio Benchmarks
SaaS businesses chase 3:1 because recurring revenue and high gross margins make long customer lifetimes predictable. E-commerce startups work with tighter margins and shorter purchase cycles, so 2:1 can still be workable if repeat purchase frequency is decent and inventory costs stay under control. Subscription box companies offset higher initial CAC by locking in recurring revenue, but churn needs constant attention. One bad cancellation wave destroys the whole model.
Fashion and apparel brands wrestle with high CAC because paid advertising is competitive and you need constant creative refreshes to keep brand momentum. Niche categories like eco-friendly specialty foods or handmade goods can get lower CAC through targeted communities and organic word-of-mouth. Loyal micro-audiences convert at higher rates without heavy ad spend. Marketplace businesses complicate everything because you’re acquiring both supply and demand side users. LTV calculations have to account for transaction fees, repeat usage patterns, and the different cost structures for attracting sellers versus buyers.
Business model patterns that shift the benchmark:
- SaaS with monthly subscriptions: 3:1 is the floor. Many aim for 4:1 once retention stabilizes.
- E-commerce with low repeat rates: 2:1 can work if margin improvements or bundling can raise AOV.
- Subscription commerce (recurring physical products): Target 3:1, but expect higher churn than SaaS. Focus on first box margin recovery.
- Marketplaces: Calculate separate LTV:CAC for each side. Blended ratios can hide supply-side overspend.
- Enterprise SaaS with annual contracts: Longer sales cycles mean higher CAC, but multi-year LTV should still hit 3:1 within the first contract period.
- DTC brands relying on influencer marketing: CAC can spike during scaling. Track LTV per cohort to avoid overpaying for low-retention audiences.
Research from 2024 shows marketing budgets in e-commerce typically allocate around forty-two percent to customer acquisition, and many startups end up paying roughly twice the optimal CAC because they chase volume before validating channel efficiency. The ratio you target should match your gross margin reality and the capital you have available to fund the gap between acquisition spend and revenue return.
How Startup Maturity Affects the LTV to CAC Ratio

Early-Stage Expectations
Seed-stage startups often run ratios between 1:1 and 2:1 while testing product-market fit and figuring out which acquisition channels actually convert. Investors get that early cohorts won’t reflect scalable economics because you’re still iterating messaging, refining onboarding, and learning which customer segments stick around. A ratio below 3:1 is acceptable at this stage if you can show improving trends. Each new cohort should demonstrate better retention, higher conversion rates, or lower CAC as you optimize the funnel.
Growth-Stage Expectations
Once you hit Series A and beyond, the 3:1 benchmark becomes non-negotiable for most investors. They want proof that your unit economics work at scale, with consistent ratios across multiple cohorts and predictable payback periods under twelve months. Ratios above 4:1 at this stage can actually hurt you in funding conversations because they signal you’re leaving growth on the table. Investors would rather see you reinvest margin into acquiring more customers and capturing market share, as long as the incremental spend still returns at least 3:1 and you’re not just buying revenue that churns out fast.
Operational Levers That Improve LTV to CAC Ratio

Increasing LTV means keeping customers longer and getting them to spend more while they’re active. Loyalty programs that reward repeat purchases, personalized product recommendations based on browsing and purchase history, subscription models that lock in recurring revenue. All of that extends the relationship and multiplies the value each customer generates. Upselling premium tiers or cross-selling complementary products raises average order value without adding acquisition cost. Retention improvements like better onboarding, proactive customer support, and regular engagement through email or in-app messaging reduce churn and stretch the lifetime denominator in your LTV formula.
Reducing CAC starts with shifting spend toward lower-cost channels. Organic SEO and content marketing take time to build but deliver customers at near-zero incremental cost once the flywheel spins. Targeted email nurturing converts warm leads without the auction dynamics of paid ads. Referral programs turn existing customers into acquisition channels. Affiliate partnerships let you pay only for results. Segmentation is the backbone. Stop spending the same amount on every audience. Analyze which cohorts have the highest LTV, then allocate acquisition budget to the channels and demographics that deliver profitable customers, not just volume.
Dashboards and cohort tracking systems keep the ratio honest. Track LTV and CAC at the cohort level, broken out by acquisition channel, customer segment, and time period. Set explicit ratio targets for each channel and review them monthly. Measure payback period alongside the ratio so you know how long capital is tied up before you recover acquisition spend. Product-market fit failures account for thirty-four percent of startup deaths, and weak segmentation is a common driver. When you treat all customers as equal, you overspend on low-value segments and underfund the audiences that actually drive sustainable growth.
Five tactics that move the ratio in the right direction:
- Run cohort retention analysis monthly to spot churn trends early and intervene before LTV drops.
- Shift budget from paid ads to organic content and referral loops as soon as they show repeatable conversion.
- Test pricing increases on new cohorts to lift ARPA without changing acquisition spend.
- Automate onboarding and nurture sequences to reduce support overhead that inflates effective CAC.
- Segment acquisition spend by channel LTV:CAC and cut underperforming channels even if they deliver volume.
CAC Payback Period and Its Link to the LTV to CAC Ratio
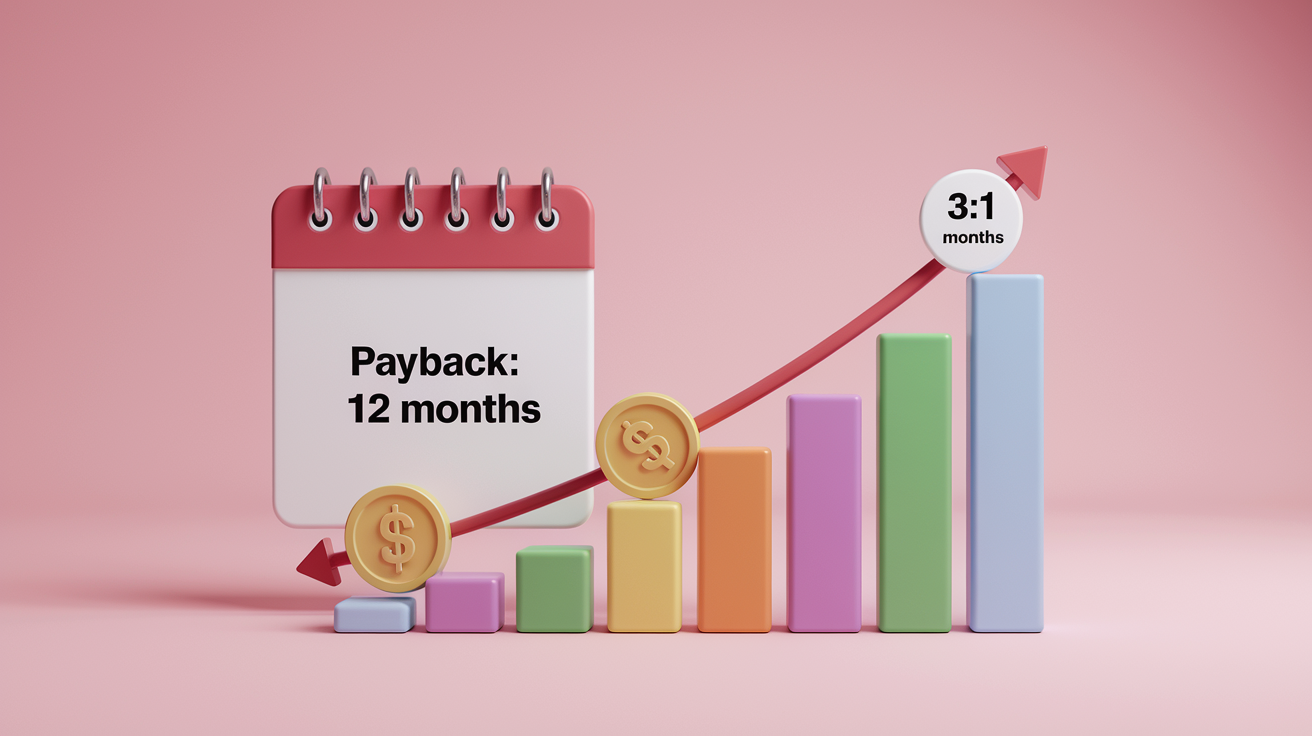
CAC payback period measures how many months it takes for a new customer to generate enough gross margin to cover the cost of acquiring them. Calculate it by dividing your CAC by the monthly gross margin each customer contributes. If you spend $640 to acquire a customer and they generate $80 in monthly gross margin, your payback period is eight months. Most investors want payback windows at or below twelve months because longer periods tie up working capital and slow your ability to reinvest acquisition dollars into growth.
A strong LTV to CAC ratio doesn’t guarantee a workable payback period. You can have a 3:1 ratio but still face a twenty-four month payback if your customers pay slowly or your margin per period is thin. That mismatch creates a funding trap. You need outside capital to bridge the gap between acquisition spend and cash recovery, even though the unit economics eventually work. Shortening payback means either raising prices, increasing purchase frequency, or cutting CAC through more efficient channels.
Here’s a simple payback example. You run an inside sales team where each rep costs $13,000 per month fully loaded and closes two customers per month. That implies a CAC of $6,500 per customer, not counting marketing spend or management overhead. To recover CAC within twelve months, each new customer needs to generate at least $6,500 in gross margin over the first year. If your product is priced at $200 per month with an eighty percent gross margin, monthly margin contribution is $160. $6,500 divided by $160 gives you a payback period just over forty months. The unit economics look decent on an LTV basis if retention is strong, but the capital requirement to scale that sales team is unworkable without external funding or a significant pricing increase.
Practical Examples of Startup LTV to CAC Ratio Benchmarks
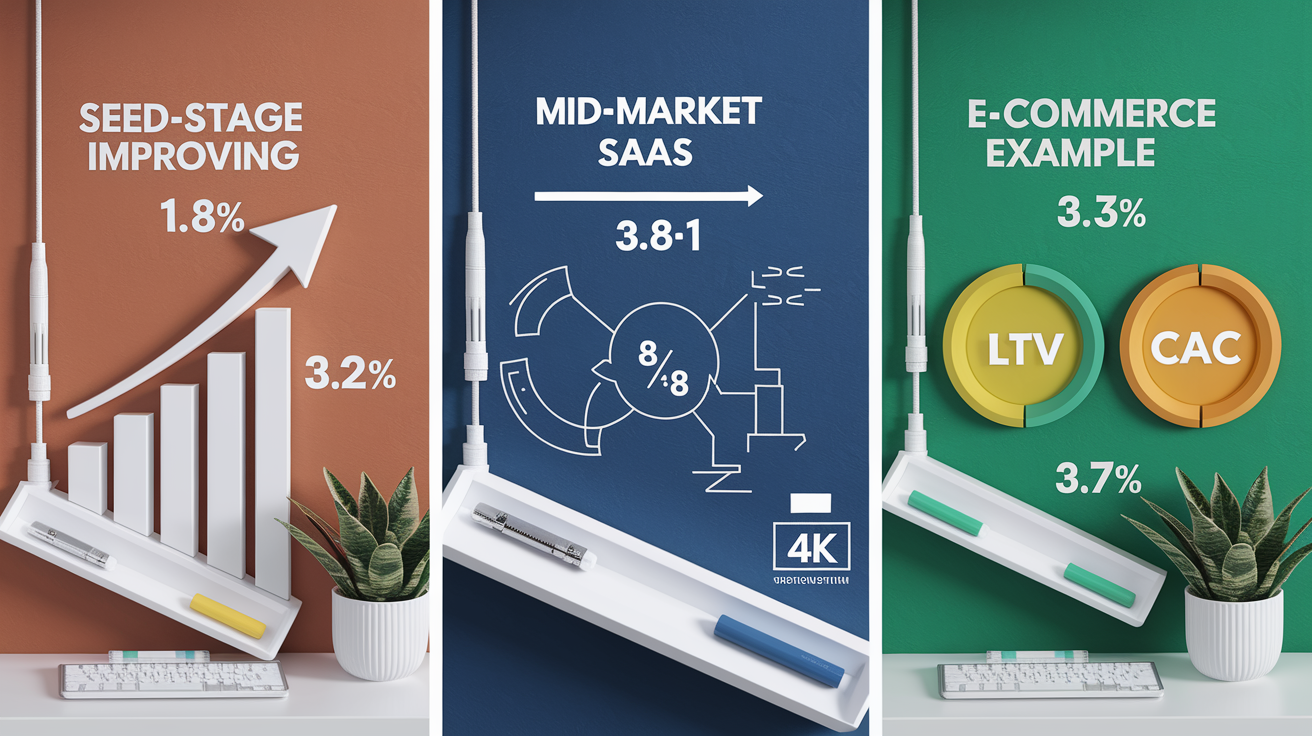
A mid-market SaaS company sells an annual contract at $12,000 with an eighty-five percent gross margin, and customers stay an average of three years. LTV equals $12,000 times 0.85 times three, which gives $30,600. The sales team spends $8,000 in blended acquisition cost per customer when you include salaries, commissions, software, and a portion of marketing spend. $30,600 divided by $8,000 equals an LTV to CAC ratio of 3.8:1. That’s healthy and attractive to growth investors, especially if the payback period sits under twelve months.
An e-commerce brand in the eco-friendly home goods space sees an average order value of $75 with a fifty percent gross margin. Purchase frequency averages 2.4 times per year, and customers stay active for two years. LTV is $75 times 0.5 times 2.4 times two, which equals $180. The brand spends $60 in blended CAC through a mix of Facebook ads, Google Shopping, and email nurturing. $180 divided by $60 gives a 3:1 ratio. Research from 2024 shows realistic e-commerce LTV around $300 when retention and frequency are optimized, so this brand has room to grow LTV by improving repeat purchase campaigns or expanding product lines that encourage cross-buy.
Real funding outcomes show what investors reward. One seed-stage DTC brand brought its LTV to CAC ratio from 1.8:1 to 3.2:1 over six months by cutting underperforming paid social channels and investing in referral loops and organic content. That improvement helped close a $7.6 million Series A. Another early-stage subscription box company demonstrated improving cohort economics from 2.1:1 to 3.4:1 and raised $500,000 in seed funding. A European marketplace startup hit 3.5:1 on the demand side while still figuring out supply-side unit economics, and that partial proof point supported a €500,000 pre-seed round. These examples show that investors don’t always require perfect ratios across the board, but they need to see the trajectory moving toward 3:1 and evidence that you understand which levers to pull when the ratio dips.
Final Words
Use the 1:1–4:1 rule as your quick check: under 1:1 means you’re losing money, 2:1 is acceptable, and 3:1 is the usual sweet spot.
We covered how to calculate LTV and CAC, how benchmarks change by industry and stage, practical levers to lift the ratio, and why CAC payback matters.
Track LTV:CAC and CAC payback monthly, focus on retention and efficient acquisition, and bring the numbers to funding talks. Do that and you’ll move toward the LTV to CAC ratio benchmark for startups investors expect.
FAQ
Q: What is a healthy LTV:CAC ratio for startups?
A: A healthy LTV:CAC ratio for startups is about 3:1; 2:1 is acceptable, below 1:1 is poor, and above 4:1 may indicate underinvestment in growth.
Q: How do I calculate LTV and CAC?
A: The LTV and CAC are calculated as: LTV = ARPA × gross margin × customer lifetime. CAC = total acquisition spend ÷ new customers, including ads, salaries, commissions, and agency fees.
Q: How do investors interpret LTV:CAC at seed versus growth stage?
A: Investors interpret LTV:CAC leniently at seed (1–2:1 may be OK temporarily) but expect scalable ~3:1 at growth stage and check payback periods, often preferring ≤12 months.
Q: What does a ratio below 1:1 or above 4:1 mean?
A: A ratio below 1:1 means you lose money acquiring customers; a ratio above 4:1 may mean you’re not investing enough in growth and could be missing scaling opportunities.
Q: How does the CAC payback period relate to LTV:CAC?
A: The CAC payback period equals CAC ÷ monthly gross margin per customer; shorter paybacks (≤12 months) make a given LTV:CAC more attractive and reduce cash flow risk.
Q: What industry benchmarks should I expect for LTV:CAC?
A: Industry benchmarks vary: SaaS often targets ~3:1, subscription and enterprise can support higher LTV, e‑commerce tolerates lower ratios due to thin margins, and marketplaces vary by take rate.
Q: What operational levers improve the LTV:CAC ratio?
A: Key levers to improve the ratio are boosting retention and recurring revenue, increasing purchase frequency and average order value, lowering CAC with SEO/referrals, and optimizing ad spend and segmentation.
Q: What metrics should I track to keep LTV:CAC accurate?
A: Track ARPA, gross margin, churn or customer lifetime, detailed acquisition spend, new customers, LTV:CAC by cohort, and CAC payback to spot trends and campaign ROI.
Q: Can a very high LTV:CAC ratio be a problem?
A: A very high LTV:CAC (over 4:1) can be a problem because it suggests underinvestment in acquisition; consider increasing CAC until growth and payback still fit your cash plan.
Q: What does a 3:1 LTV:CAC ratio look like with real numbers?
A: A 3:1 example: LTV $300 and CAC $100 gives a 3:1 ratio. If monthly gross margin per customer is $25, CAC payback = $100 ÷ $25 = 4 months, a healthy payback.