
Think a Fed rate hike automatically means your mortgage rate will jump? Not quite.
The Fed sets the overnight bank rate, but 30-year mortgages follow long-term bond yields and mortgage-backed securities.
That gap means a Fed move can raise mortgage costs sharply, nudge them a little, or barely change them depending on inflation expectations, MBS demand, and market stress.
This post will show the real signals that shift mortgage pricing, the short- versus long-term mechanics, and three practical steps to protect your monthly payment.
Understanding the Fed Rate Hike’s Influence on Mortgage Rates
The federal funds rate is what banks charge each other to borrow reserves overnight. When the Federal Reserve raises this rate, it directly hits short-term borrowing costs across the banking system. But your 30-year mortgage isn’t a short-term loan. That’s why mortgage rates don’t track the Fed funds rate one-for-one.
Mortgage rates, especially on 30-year fixed loans, get driven mostly by long-term bond yields. The 10-year Treasury yield and mortgage-backed securities (MBS) yields. Bond investors set these by looking at inflation expectations, economic growth forecasts, and where global capital is flowing. When the Fed hikes, bond markets react by adjusting those long-term yields based on what the hike signals about inflation and growth. If a hike convinces investors that inflation will cool, long-term yields might rise just slightly or even fall if recession fears start building. If the hike signals persistent inflation or a strong economy, long-term yields usually climb.
Markets react within minutes of an FOMC announcement. You’ll see Treasury yields and MBS prices move during the press conference. Lenders typically reprice mortgage rate sheets within hours or by the next business day. Full adjustment across the retail mortgage market, including weekly survey averages, takes one to three weeks as lenders adjust pipelines and hedging positions. In 2021 the 30-year fixed mortgage averaged around 3.00 percent. By late 2022, after the Fed moved rates from near zero to the 4.25 to 5.50 percent range, 30-year mortgage rates had spiked above 7.00 percent. A nearly 4 percentage point increase in roughly nine months.
Five key signals that immediately change mortgage rates after a Fed announcement:
- 10-year Treasury yield reaction – If it jumps more than 10 basis points within the first hour, expect lenders to reprice higher by the next morning.
- Fed forward guidance tone – “Higher for longer” language pushes long-term yields and mortgage rates up. “Data dependent” or “pause” signals can limit upside.
- MBS spread widening – If MBS yields rise faster than Treasuries, mortgage rates will move more than the Fed hike alone suggests.
- Equity and credit market stress – Sharp stock selloffs or corporate credit spread widening often push mortgage spreads wider as risk appetite falls.
- Inflation surprise component – If the Fed cites upside inflation risk in the statement, bond markets reprice inflation expectations immediately, lifting mortgage rates.
Market Mechanics That Translate Fed Rate Hikes Into Mortgage Rates

The 10-year Treasury yield is the primary benchmark for pricing 30-year fixed mortgages. Lenders and MBS investors use the 10-year as a base, then add a spread to cover prepayment risk, credit risk, servicing costs, and profit margin. Historically, that spread has ranged from about 1.6 to 2.0 percentage points in stable markets. It can widen beyond 2.5 points during periods of market stress or heavy Fed balance-sheet runoff.
MBS are pools of home loans packaged and sold to investors. When the Fed was buying MBS during quantitative easing (QE), it absorbed supply and pushed MBS prices up, which lowered mortgage rates. When the Fed runs quantitative tightening (QT) and lets MBS roll off its balance sheet without replacement, private investors must absorb more supply. That extra supply pushes MBS prices down and yields up, widening the spread between the 10-year Treasury and mortgage rates.
Lender margins also respond to pipeline risk. If bond markets are volatile, lenders hedge more aggressively and may widen their pricing even if Treasury yields are flat.
Credit spreads and secondary market demand further influence final mortgage pricing. During periods of economic uncertainty, investors demand higher yields to compensate for perceived prepayment or default risk, which widens mortgage spreads. Strong MBS demand from pension funds, insurance companies, or foreign buyers can compress spreads and keep mortgage rates lower than the 10-year Treasury movement alone would suggest.
| Driver | How It Works | Impact on Mortgage Rates |
|---|---|---|
| 10-year Treasury yield | Base benchmark set by bond market expectations for inflation and growth over the long term | Direct correlation. If 10-year rises 0.50%, mortgage rates typically rise 0.40 to 0.60% |
| Fed MBS holdings (QE/QT) | Fed purchases lower MBS yields by absorbing supply. Runoff increases supply and raises yields | QT typically adds 0.20 to 0.50% to mortgage rates vs QE periods |
| MBS spread to Treasuries | Investor demand for MBS relative to Treasuries. Prepayment risk and liquidity factors | Wider spreads during volatility can add 0.25 to 0.75% beyond Treasury moves |
| Lender margin and hedging | Lenders adjust pricing based on pipeline risk, competition, and cost of funds | Can add or subtract 0.125 to 0.375% from the market driven rate |
Short-Term vs Long-Term Mortgage Rate Movements After Fed Hikes

Markets digest Fed announcements in real time. The mortgage market adjusts in waves. In the first hours and days after an FOMC decision, you’ll see sharp moves in Treasury futures, MBS prices, and lender rate sheets. This is the immediate reaction driven by surprise and headline interpretation.
Over the following weeks to months, mortgage rates settle into a trend shaped by forward guidance, inflation data, employment reports, and global bond flows. Sometimes the initial spike reverses if economic data weaken or if the Fed signals it’s near the end of its hiking cycle. Other times, rates continue climbing if inflation remains sticky or if the economy proves more resilient than expected.
Short-term volatility reflects positioning and sentiment. Longer-term trends reflect changing expectations about the entire interest rate path.
Four factors that drive near-term vs long-term mortgage rate paths:
- Fed dot plot and forward guidance – Market pricing for the next 12 to 24 months adjusts based on the Fed’s own rate projections. If the dot plot shows more hikes ahead, long-term yields rise.
- Inflation and growth surprises – Monthly CPI, PCE, and payroll reports can shift expectations by 25 to 50 basis points in a single day. Sustained surprises reshape the entire yield curve.
- Yield curve shape and inversion – When short-term rates exceed long-term rates (inversion), it signals recession risk. This often causes long-term mortgage rates to fall even as the Fed continues hiking.
- Global risk and capital flows – Geopolitical events, banking stress, or foreign central bank actions can drive demand for U.S. Treasuries, compressing long-term yields and mortgage rates despite Fed tightening.
Historical Fed Hiking Cycles and Their Mortgage Rate Outcomes
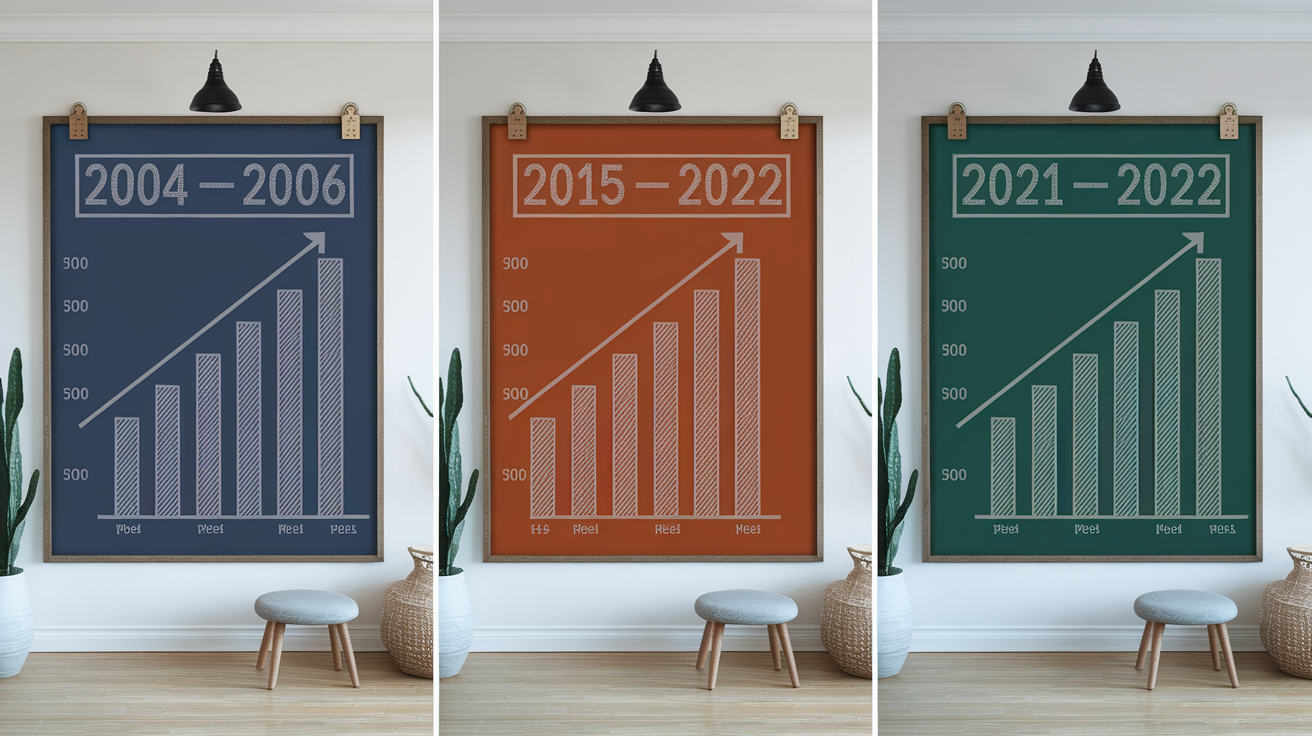
Between June 2004 and June 2006, the Fed raised the federal funds rate from about 1.00 percent to 5.25 percent. A 4.25 percentage point increase over two years. During that period, 30-year mortgage rates rose from roughly 5.5 percent to around 6.5 percent, a move of only 1.0 percentage point. The smaller mortgage increase reflected stable inflation expectations and strong MBS demand from investors seeking yield.
From December 2015 to December 2018, the Fed increased the funds rate from 0.25 percent to 2.50 percent. Over that cycle, 30-year mortgage rates climbed from about 3.9 percent to roughly 4.8 percent. The mortgage move was again smaller in magnitude because the Fed’s pace was gradual, inflation remained subdued, and the yield curve flattened as growth concerns grew.
The 2021 to 2022 tightening was the most dramatic in speed and scale. The Fed moved the funds rate from near zero in early 2022 to a range of 4.25 to 5.50 percent by mid-2023. Meanwhile, 30-year mortgage rates surged from around 3.0 percent in early 2021 to peaks above 7.0 percent by late 2022. A nearly 4 percentage point jump. This outsized move occurred because inflation surprised sharply to the upside, the Fed ended MBS purchases and began balance-sheet runoff, and bond markets repriced long-term inflation expectations aggressively.
Three key lessons from historical cycles:
- Mortgage rates don’t match Fed hikes one for one – The size and speed of mortgage rate changes depend on inflation expectations, MBS technicals, and economic growth signals, not just the magnitude of Fed funds increases.
- The pace of hiking matters as much as the total increase – Rapid, large hikes (2022) trigger sharper mortgage moves because markets reprice expectations quickly. Gradual cycles (2015 to 2018) allow smoother adjustments.
- Recession fears can reverse mortgage trends mid-cycle – If a hiking cycle sparks recession worries, long-term yields and mortgage rates may fall even before the Fed stops raising short-term rates (yield curve inversion scenario).
Economic Indicators That Shape Mortgage Rate Reactions After a Fed Hike

Inflation is the single biggest driver of long-term interest rates because it erodes the real return on bonds. When monthly CPI or PCE data surprise higher, bond investors demand higher yields to compensate, and mortgage rates climb quickly. Cooling inflation can push mortgage rates lower even if the Fed keeps short-term rates elevated, because investors believe the Fed will eventually cut.
Six specific indicators that cause large mortgage rate moves:
- Consumer Price Index (CPI) – Monthly report on headline and core inflation. A 0.1 to 0.2 percentage point upside surprise can push mortgage rates up 0.10 to 0.25 percent within days.
- Personal Consumption Expenditures (PCE) – The Fed’s preferred inflation measure. Similar impact to CPI but often smoother and slightly less volatile.
- Nonfarm Payrolls and unemployment rate – Strong job growth and low unemployment signal a tight labor market and potential wage inflation, raising long-term yields.
- GDP releases – Quarterly growth data. Stronger than expected GDP can lift mortgage rates by signaling the Fed may need to keep policy tight longer.
- ISM Manufacturing and Services PMI – Monthly surveys of business activity. Expansion readings above 50 support higher long-term rates. Contraction readings below 50 can lower them.
- Global bond yields and central bank actions – European Central Bank or Bank of England rate decisions and Treasury auctions influence global capital flows and U.S. mortgage pricing.
Timing mortgage decisions around these releases matters. If you’re floating a rate and CPI is due in two days, you face upside risk if the number surprises hot. Locking before a major release removes that uncertainty but costs you any benefit if the data come in cool and rates fall.
Practical Mortgage Interpretation Framework After a Fed Hike

Start by checking the 10-year Treasury yield immediately after the FOMC announcement. If it rises sharply (more than 10 basis points in the first hour), expect lenders to reprice mortgage rates higher by the next business day. If the 10-year yield falls or stays flat despite a Fed hike, it usually signals that bond investors are more worried about slowing growth or recession than about inflation. Mortgage rates may not rise or could even decline.
Next, look at MBS spreads relative to the 10-year Treasury. You can find daily MBS yield data from sources that track the Fannie Mae 30-year current coupon or from mortgage industry reports. If the spread widens (meaning MBS yields rise faster than Treasuries), mortgage rates will increase more than the Treasury move alone suggests. Spread widening often happens during Fed QT, when the Fed is shrinking its MBS holdings, or during periods of high refinance activity that changes prepayment expectations.
Then evaluate the tone of Fed communication. Read the FOMC statement and listen to the press conference for clues about future policy. Phrases like “additional firming may be appropriate” signal more hikes ahead and usually push long-term rates up. Language such as “the Committee will assess incoming data” or “policy is restrictive” suggests the Fed may be nearing a pause, which can stabilize or lower mortgage rates. The Summary of Economic Projections (SEP) and the dot plot (the Fed’s internal forecast of the funds rate path) are key tools for understanding how many more hikes markets should expect.
Weigh recession versus inflation signals in the broader economy. If recent data show slowing growth, rising jobless claims, or contracting manufacturing, bond markets may price in future Fed cuts even while the Fed is still hiking. That expectation can compress long-term yields and hold mortgage rates steady or push them lower. If inflation remains elevated and growth stays strong, markets price a higher for longer scenario, and mortgage rates typically continue rising.
How Lenders Adjust Pricing and Margins After Fed Rate Hikes

Lenders reprice mortgage rate sheets multiple times per day when bond markets are volatile. Each lender hedges its pipeline (the pool of locked loans awaiting closing) by selling MBS or Treasury futures. When Treasury or MBS yields spike, the cost of that hedging rises, and lenders immediately widen their profit margins to protect against losses.
Margin widening means the spread between the wholesale market rate (what the lender can sell the loan for) and the retail rate (what the lender quotes you) increases. In stable markets, this margin might be 0.25 to 0.50 percentage points. During periods of uncertainty or heavy pipeline volume, lenders may widen margins to 0.75 percentage points or more, lifting your quoted rate beyond what the 10-year Treasury move alone would suggest.
| Factor | Lender Adjustment | Impact on Rate |
|---|---|---|
| MBS market volatility | Increase hedging cost and margin to offset risk | +0.125 to +0.375 percentage points |
| Pipeline volume surge | Slow processing or widen pricing to manage capacity | +0.125 to +0.25 percentage points |
| Extended rate lock period | Charge lock extension fees or higher initial rate for 60+ day locks | +0.125 to +0.50 percentage points for 90 day locks |
Lock windows are the contractual period during which your rate is guaranteed. Most purchase loans offer 30 or 45 day locks at standard pricing. Longer locks (60 or 90 days) cost more because the lender must hedge for a longer period. If rates fall during your lock, you generally can’t take advantage unless you have a float down option, which itself may carry a fee or require rates to drop by a minimum amount, such as 0.25 or 0.50 percentage points, before you can re-lock lower.
What Fed Rate Hikes Mean for Fixed-Rate vs Adjustable-Rate Mortgages

Fixed rate mortgages are priced off long-term bond yields, so they move with the 10-year Treasury and MBS market. A Fed hike influences fixed rates indirectly by changing inflation and growth expectations. If the hike convinces bond investors that inflation will moderate, fixed mortgage rates may rise only modestly or even fall. If the hike signals persistent inflation, fixed rates climb as investors demand higher long-term yields.
Adjustable rate mortgages (ARMs) are tied to short-term indexes like the Secured Overnight Financing Rate (SOFR), the 1-year Treasury, or the prime rate. When the Fed raises the funds rate, these short-term indexes usually rise within days or weeks. If you hold a 5/1 ARM that adjusts annually after the initial five-year fixed period, your rate at the first adjustment will reflect the current level of your index plus your margin. During the 2021 to 2022 hiking cycle, SOFR climbed from near zero to over 5.0 percent, causing ARM rates at adjustment to jump sharply for borrowers whose initial fixed periods ended.
When each product benefits in a hiking cycle:
- Choose a fixed rate mortgage when you expect rates to stay elevated or rise further, when you plan to stay in the home long term, or when you want payment certainty regardless of Fed moves.
- Choose an ARM when you expect to sell or refinance before the first adjustment, when the initial fixed period matches your ownership timeline, or when the discount vs fixed rates is large enough to offset adjustment risk.
- ARMs become riskier in a rising rate environment if you can’t refinance before adjustment. Your payment can increase hundreds of dollars per month if the index has climbed.
- Fixed rates protect you from future rate increases but lock you into a higher rate if the Fed eventually cuts and long-term yields fall.
- Hybrid strategy – Some borrowers use an ARM for the initial discount, then refinance to a fixed rate if long-term yields drop. But this depends on qualifying income and equity remaining sufficient.
Action Strategies: When to Lock or Float After a Fed Rate Hike

Lock when your closing is within 45 days and you can’t tolerate the risk of rates moving higher. Mortgage markets can reprice 0.25 percentage points in a single week if inflation data surprise or if the Fed signals additional tightening. A 30 or 45 day lock removes that uncertainty and lets you plan your monthly payment with confidence.
Float when you have a short timeline to closing (under 30 days) and market indicators suggest long-term yields are likely to fall. Floating makes sense if recent inflation data are cooling, if the Fed has signaled a pause, or if recession fears are building and pushing the 10-year Treasury yield down. Set a clear stop loss trigger: for example, lock immediately if the 10-year Treasury rises more than 20 basis points in a single week or if your lender’s rate sheet jumps 0.25 percentage points.
Seven recommended lock strategies:
- Lock before major data releases – If CPI, PCE, or Nonfarm Payrolls are due within your float window and you’re risk averse, lock the day before to avoid overnight gaps.
- Use a 30 day lock for standard purchase contracts – Most closings happen within 30 to 45 days. A 30 day lock is typically the cheapest and covers most timelines.
- Opt for a 60 day lock if your appraisal or underwriting is delayed – Paying an extra 0.125 percentage points upfront is cheaper than paying a lock extension fee later.
- Negotiate a float down option when offered – Some lenders include a one time float down if rates fall by a specified amount. Verify the minimum drop required (often 0.25 to 0.50 percentage points) and any associated fees.
- Avoid locking during the week of an FOMC meeting unless you expect a hawkish surprise – Wait until after the meeting if you think the Fed will signal a pause or if you expect bond yields to fall on the news.
- Monitor the 10-year Treasury daily once you have an accepted offer – Set alerts for moves greater than 10 basis points. If the yield jumps, lock that day.
- Don’t wait for the “perfect” rate – Trying to time the absolute bottom often results in missing a good rate. Lock when the rate fits your budget and risk tolerance.
Mortgage points let you pay an upfront fee to buy down your rate. Typically, paying 1.0 point (1 percent of the loan amount) lowers your rate by about 0.20 to 0.30 percentage points, though the exact tradeoff depends on the lender and market conditions. Points make sense if you plan to keep the loan long enough to recover the upfront cost through lower monthly payments. Temporary buydowns (such as a 2-1 buydown where the rate is reduced by 2 percentage points in year one and 1 point in year two) can be funded by the seller or lender and offer short-term payment relief without permanently lowering your note rate.
Refinancing and Affordability Decisions in a Fed Hiking Environment

For a $300,000 30-year fixed mortgage, each 0.25 percentage point increase in rate raises your monthly principal and interest payment by roughly $40 to $50. At 4.00 percent, your monthly payment is about $1,432. At 4.25 percent, it rises to approximately $1,476 (a $44 increase). At 5.00 percent, the payment jumps to around $1,610, or $178 more per month than at 4.00 percent.
Refinancing makes financial sense when the new rate is low enough that your monthly savings exceed your closing costs within a reasonable time frame. A common rule of thumb is to refinance if the new rate is at least 0.75 to 1.00 percentage point lower than your current rate. But the real test is the break-even calculation: divide total closing costs by your monthly payment savings to find the number of months required to recover the upfront expense.
Five steps for a refinance break-even calculation:
- Determine your current monthly principal and interest payment – Use your current loan balance and rate, not the original loan amount.
- Estimate the new monthly payment at the proposed refinance rate – Include the same loan balance and term (or a new term if you’re changing it).
- Calculate the monthly savings – Subtract the new payment from the current payment.
- Add up all closing costs – Include lender fees, title insurance, appraisal, and any prepaid interest or escrow adjustments. Ask your lender for a Loan Estimate.
- Divide total closing costs by monthly savings – The result is your break-even period in months. If you plan to keep the loan longer than that, refinancing saves money.
The 2022 Fed tightening cycle pushed mortgage rates from around 3.0 percent to over 7.0 percent in less than a year. Homebuyers saw monthly payments on a $400,000 loan rise from roughly $1,686 at 3.0 percent to about $2,661 at 7.0 percent (a $975 per month increase). This sharp affordability squeeze caused mortgage application volume to fall dramatically and slowed home sales as buyers were priced out or chose to wait for lower rates.
Signals to Watch Before and After Each Fed Meeting
The Fed’s dot plot is a chart showing each FOMC member’s projection for the appropriate federal funds rate at year-end for the current year and the next few years. Markets use the median dot to gauge how many more rate hikes or cuts the Fed expects. If the median dot moves higher between meetings, long-term yields typically rise as investors price in a higher terminal rate.
Six specific signals to monitor:
- FOMC statement language changes – Compare the new statement to the prior one word by word. Additions like “additional firming” or deletions of “ongoing increases” signal policy shifts.
- Fed Chair press conference tone – Listen for confidence about inflation progress or concerns about labor markets. Hawkish comments push yields up, dovish comments can lower them.
- Summary of Economic Projections (SEP) – Released quarterly, includes updated forecasts for GDP, unemployment, and inflation. Upward revisions to inflation forecasts usually raise mortgage rates.
- Fed funds futures (CME FedWatch Tool) – Shows market implied probabilities for rate changes at upcoming FOMC meetings. If probability of a hike jumps above 70 percent, expect bond markets to reprice before the meeting.
- Minutes from prior FOMC meetings – Published three weeks after each meeting, provide detailed discussion of member views and can shift expectations if they reveal more hawkish or dovish debate than the statement suggested.
- Upcoming FOMC meeting calendar – The Fed holds eight scheduled meetings per year, roughly every six weeks. Plan lock timing around these dates to avoid intraday volatility during announcements.
Tracking these signals helps you anticipate mortgage rate moves and decide when to lock. If the dot plot shows another two hikes and inflation data remain hot, floating your rate carries high risk. If the minutes reveal discussion of a pause and upcoming CPI is expected to cool, floating may be worth the gamble.
Consumer Checklist for Interpreting Mortgage Rates After a Fed Hike
Start by comparing lender rate sheets the morning after any Fed announcement. Rates can change within hours, and different lenders adjust at different speeds. Request written quotes with full APR disclosure, points, and lock terms so you can evaluate the true cost.
Your actionable checklist:
- Check the 10-year Treasury yield – Use a financial news site or Treasury market data. If it moved more than 10 basis points overnight, expect mortgage rate sheets to reflect that change by midday.
- Review upcoming economic data releases – Look at the economic calendar for CPI, PCE, and Nonfarm Payrolls dates. Avoid leaving your rate unlocked through these releases if you’re risk averse.
- Monitor Fed funds futures – Visit the CME FedWatch Tool to see market implied probabilities for the next FOMC decision. If odds of a hike are above 50 percent, lean toward locking sooner.
- Calculate your payment sensitivity – Use an online mortgage calculator to see how your monthly payment changes with ±0.25 and ±0.50 percentage point rate moves. This helps you decide your acceptable risk window.
- Ask your lender about float down options – If offered, confirm the minimum rate drop required, any fees, and expiration terms in writing.
- Set a personal rate trigger – Decide in advance the maximum rate you’ll accept. If market rates hit that level, lock immediately without second guessing.
- Track MBS spread trends – Follow mortgage industry news or lender updates for mentions of spread widening or tightening. Widening spreads mean mortgage rates rise faster than Treasuries.
- Verify lock expiration and extension costs – Confirm your lock length covers your expected closing date. Ask what the per day or per 15 day extension fee is if closing delays occur.
Final Words
In the action, this piece showed why Fed moves don’t translate one-for-one to mortgages. Long-term yields, MBS, and lender margins do the heavy lifting.
You got the timelines (minutes to weeks), the data to watch (10‑year Treasury, CPI/PCE, payrolls), and practical steps like checking market moves, comparing rate sheets, and picking a lock strategy tied to your closing window.
If you want a single frame for how to interpret fed rate hike for mortgage rates, follow the 10‑year, MBS spreads, and lender behavior, and make a plan. You can act with more confidence.
FAQ
Q: What happens to mortgage rates if the Fed raises interest rates?
A: Mortgage rates usually rise when the Fed raises interest rates, but not one-for-one; long-term bond yields, mortgage‑backed securities and lender spreads decide the size and timing, often over days to weeks.
Q: What is the 3 7 3 rule in mortgage?
A: The 3 7 3 rule in mortgage isn’t a universal standard; some lenders use it as internal shorthand for underwriting or lock policies—ask your lender what it means for down payment, reserves, or documentation.
Q: What does the Fed rate cut mean for mortgage rates?
A: A Fed rate cut tends to lower short-term rates and can push long-term yields down, possibly reducing mortgage rates—though mortgages track long-term bonds, so outcomes depend on inflation, bond demand, and spreads.
Q: Is 4.75 a high interest rate for a mortgage?
A: A 4.75% mortgage rate is moderate by recent cycles—above the 2020–21 lows and below 2022 peaks near 7%; whether it’s high depends on your credit, loan type, and current market.